Glassnode review: do on-chain metrics give retail more than free charts?
We browsed Glassnode's free-tier charts, priced its Advanced and Professional plans, and checked which on-chain metrics actually change a retail investor's decision before scoring the platform.
7.0out of 107.0
Our verdict
Glassnode's free Studio Standard tier gives a retail investor real signal already: realized price zones and long-term holder supply are both visible without paying, and they are the two metrics most likely to change what a long-term holder actually does. The paid tiers exist for a different buyer. Advanced at 49 dollars a month unlocks hourly resolution and derivatives data that a swing trader can use, but Professional at 999 dollars a month, with 1,500-plus metrics and 1-minute resolution, is built for a desk, not an individual holding a portfolio on the side.
Best for: Long-term holders who want realized-price and holder-cohort context beyond price charts
Glassnode's pitch is that a price chart tells you what happened and on-chain data tells you why. We spent time on the free tier, priced out the two paid plans, and tried to answer a narrower question than the marketing asks: does any of this change what a retail investor actually does with their holdings.
What the free tier already gives you
Studio Standard costs nothing and still ships with genuinely useful signal: T1 metrics at 24-hour resolution and one alert. Realized cap and cost basis metrics fall inside that free tier, and they matter because they show where the market's actual buy-in price sits, not just where the current price is relative to a chart pattern.
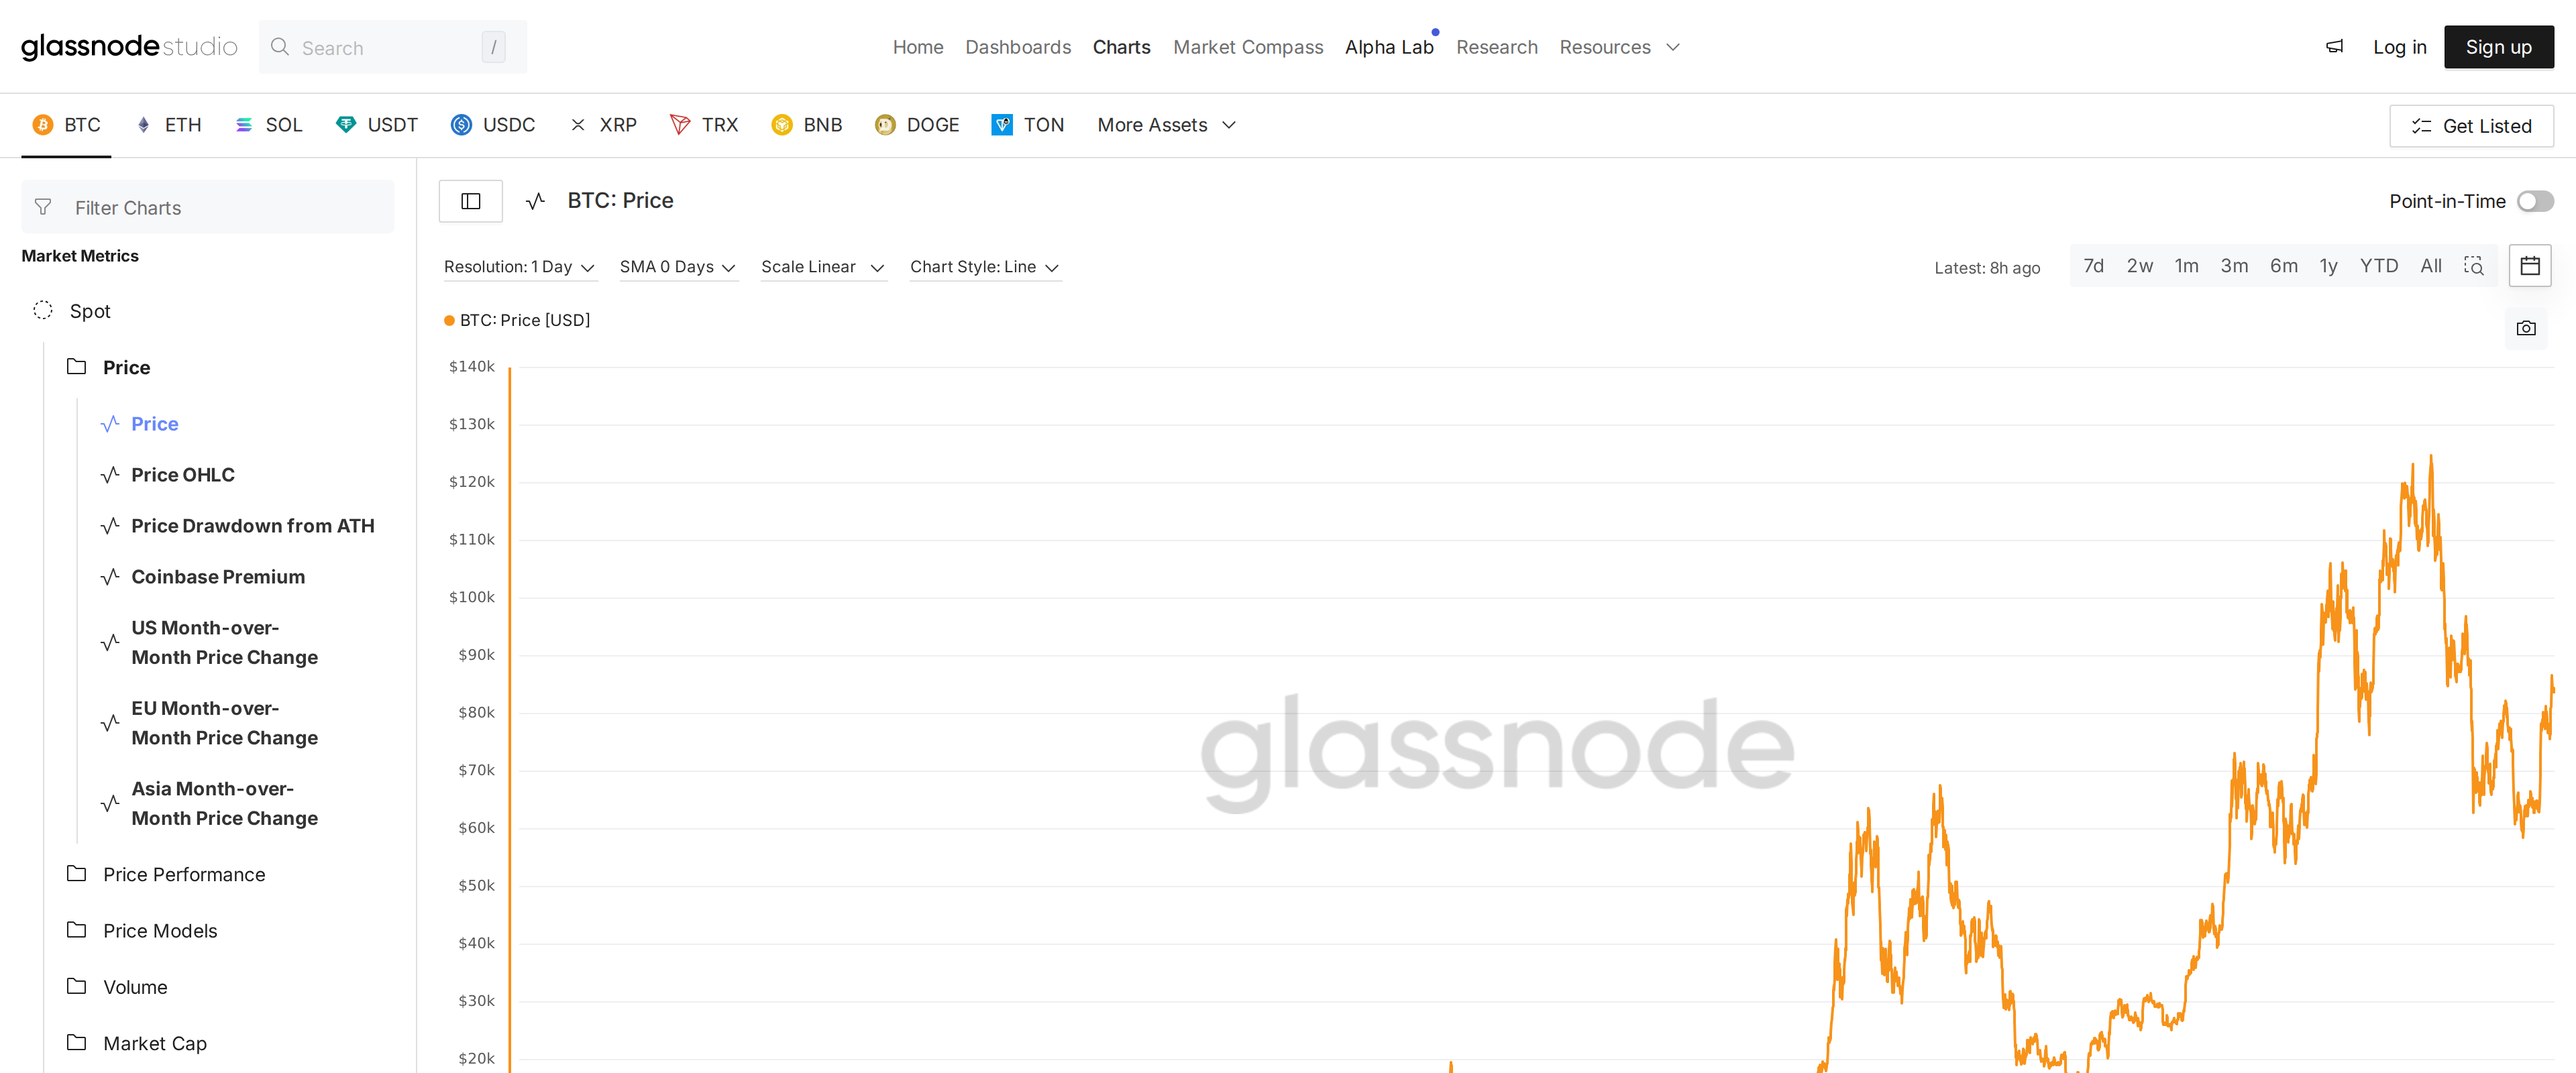
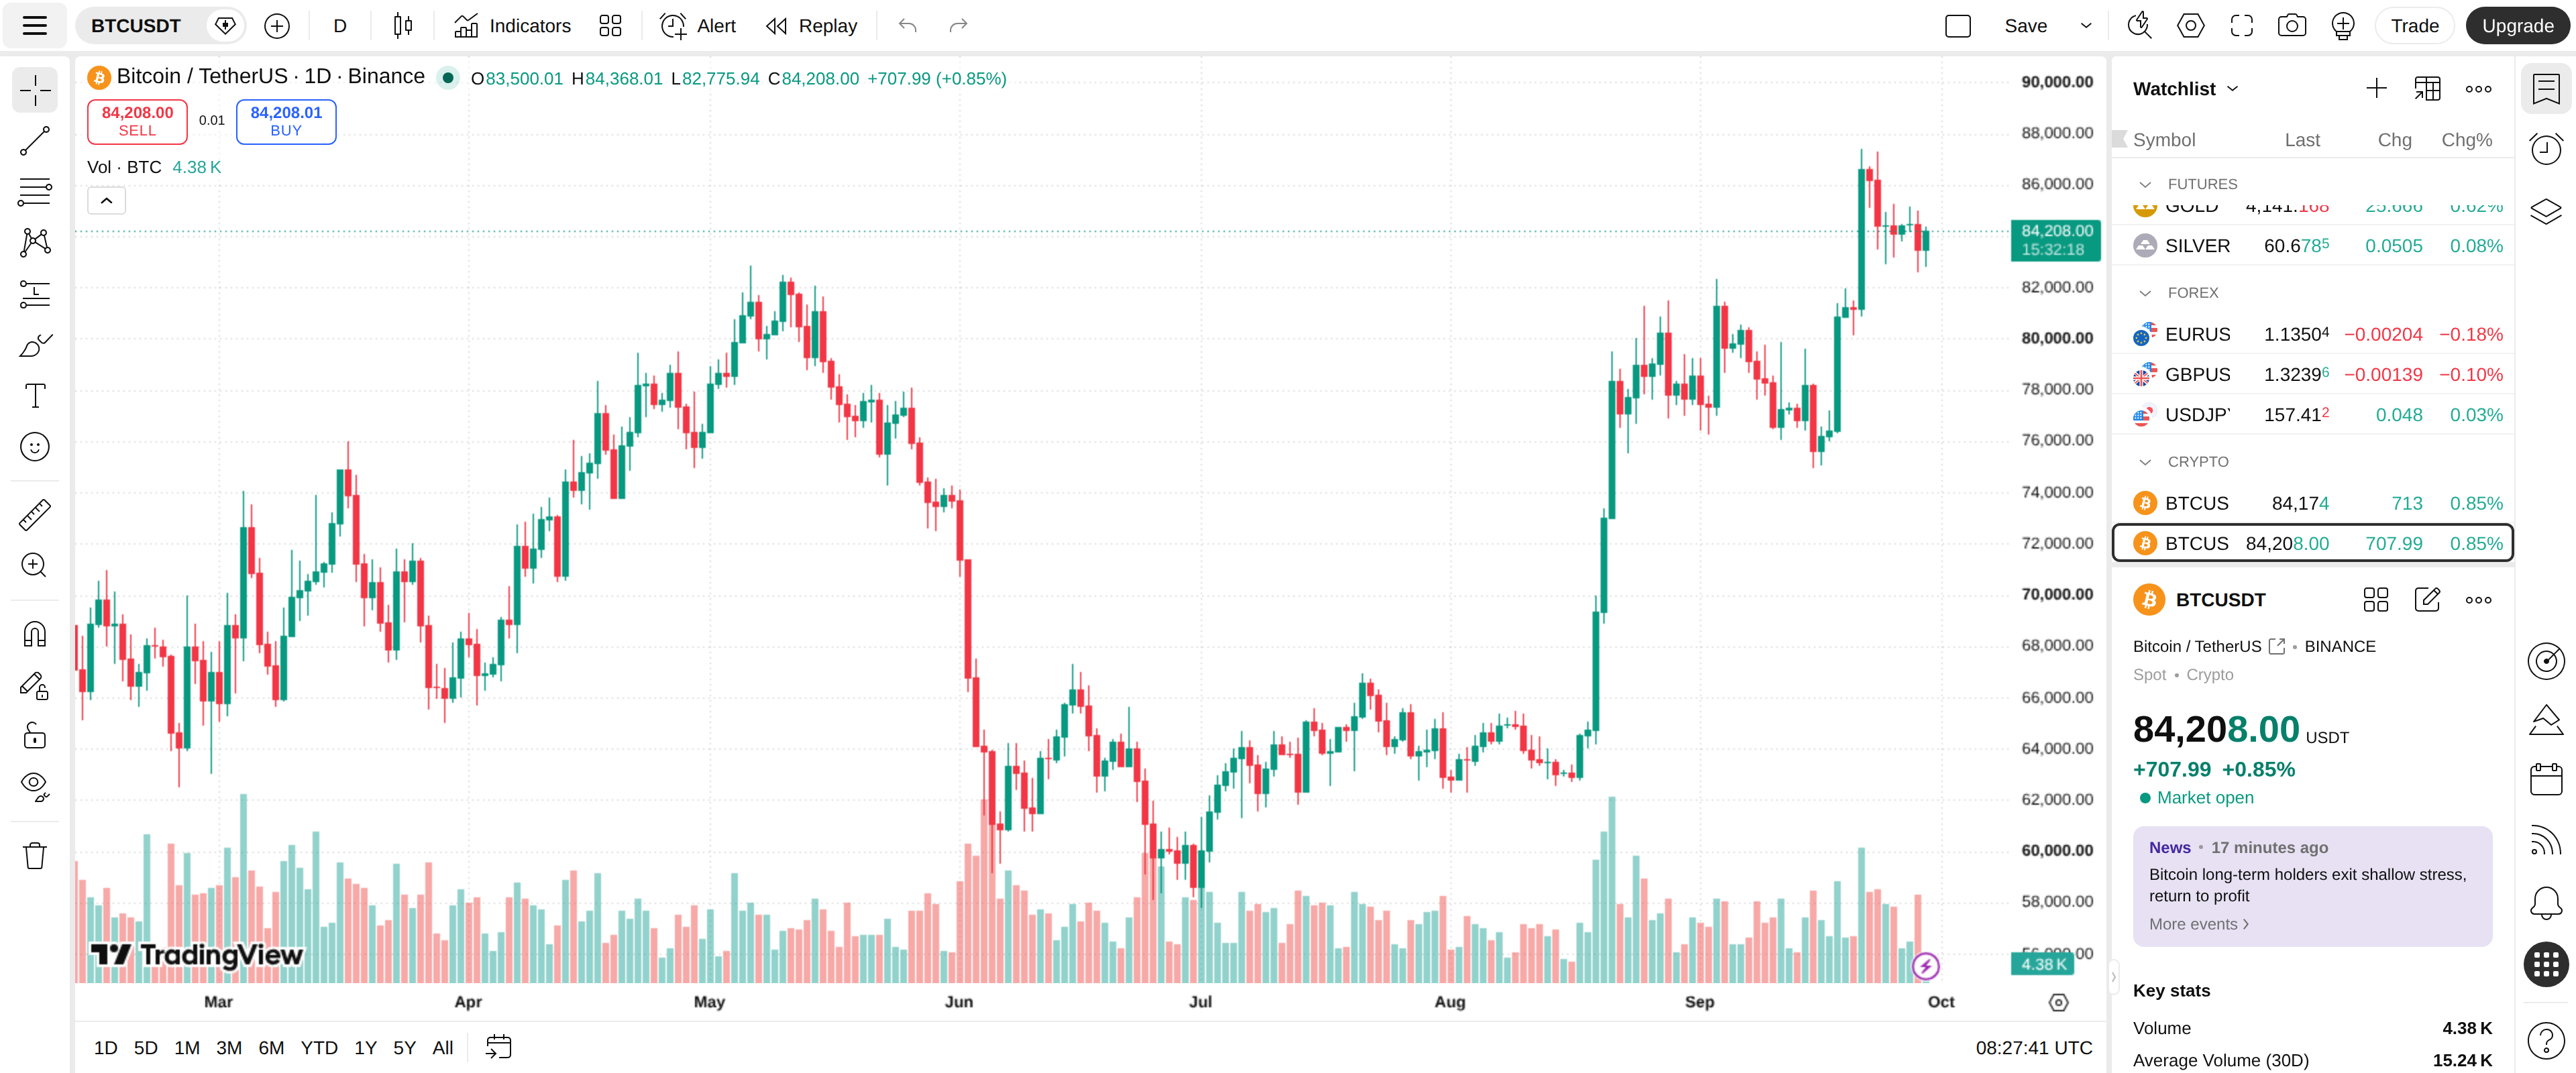
Glassnode's charts interface: the metric sidebar under Price, next to a BTC price chart running from roughly $20k to $140k
Long-term holder supply is the other metric worth knowing exists before paying anything: it separates coins that have not moved in months from coins actively changing hands, and that distinction says more about conviction in the market than volume alone. A retail investor who only ever looks at candlesticks is missing a genuinely different lens here, for free.
Where the paywall starts mattering
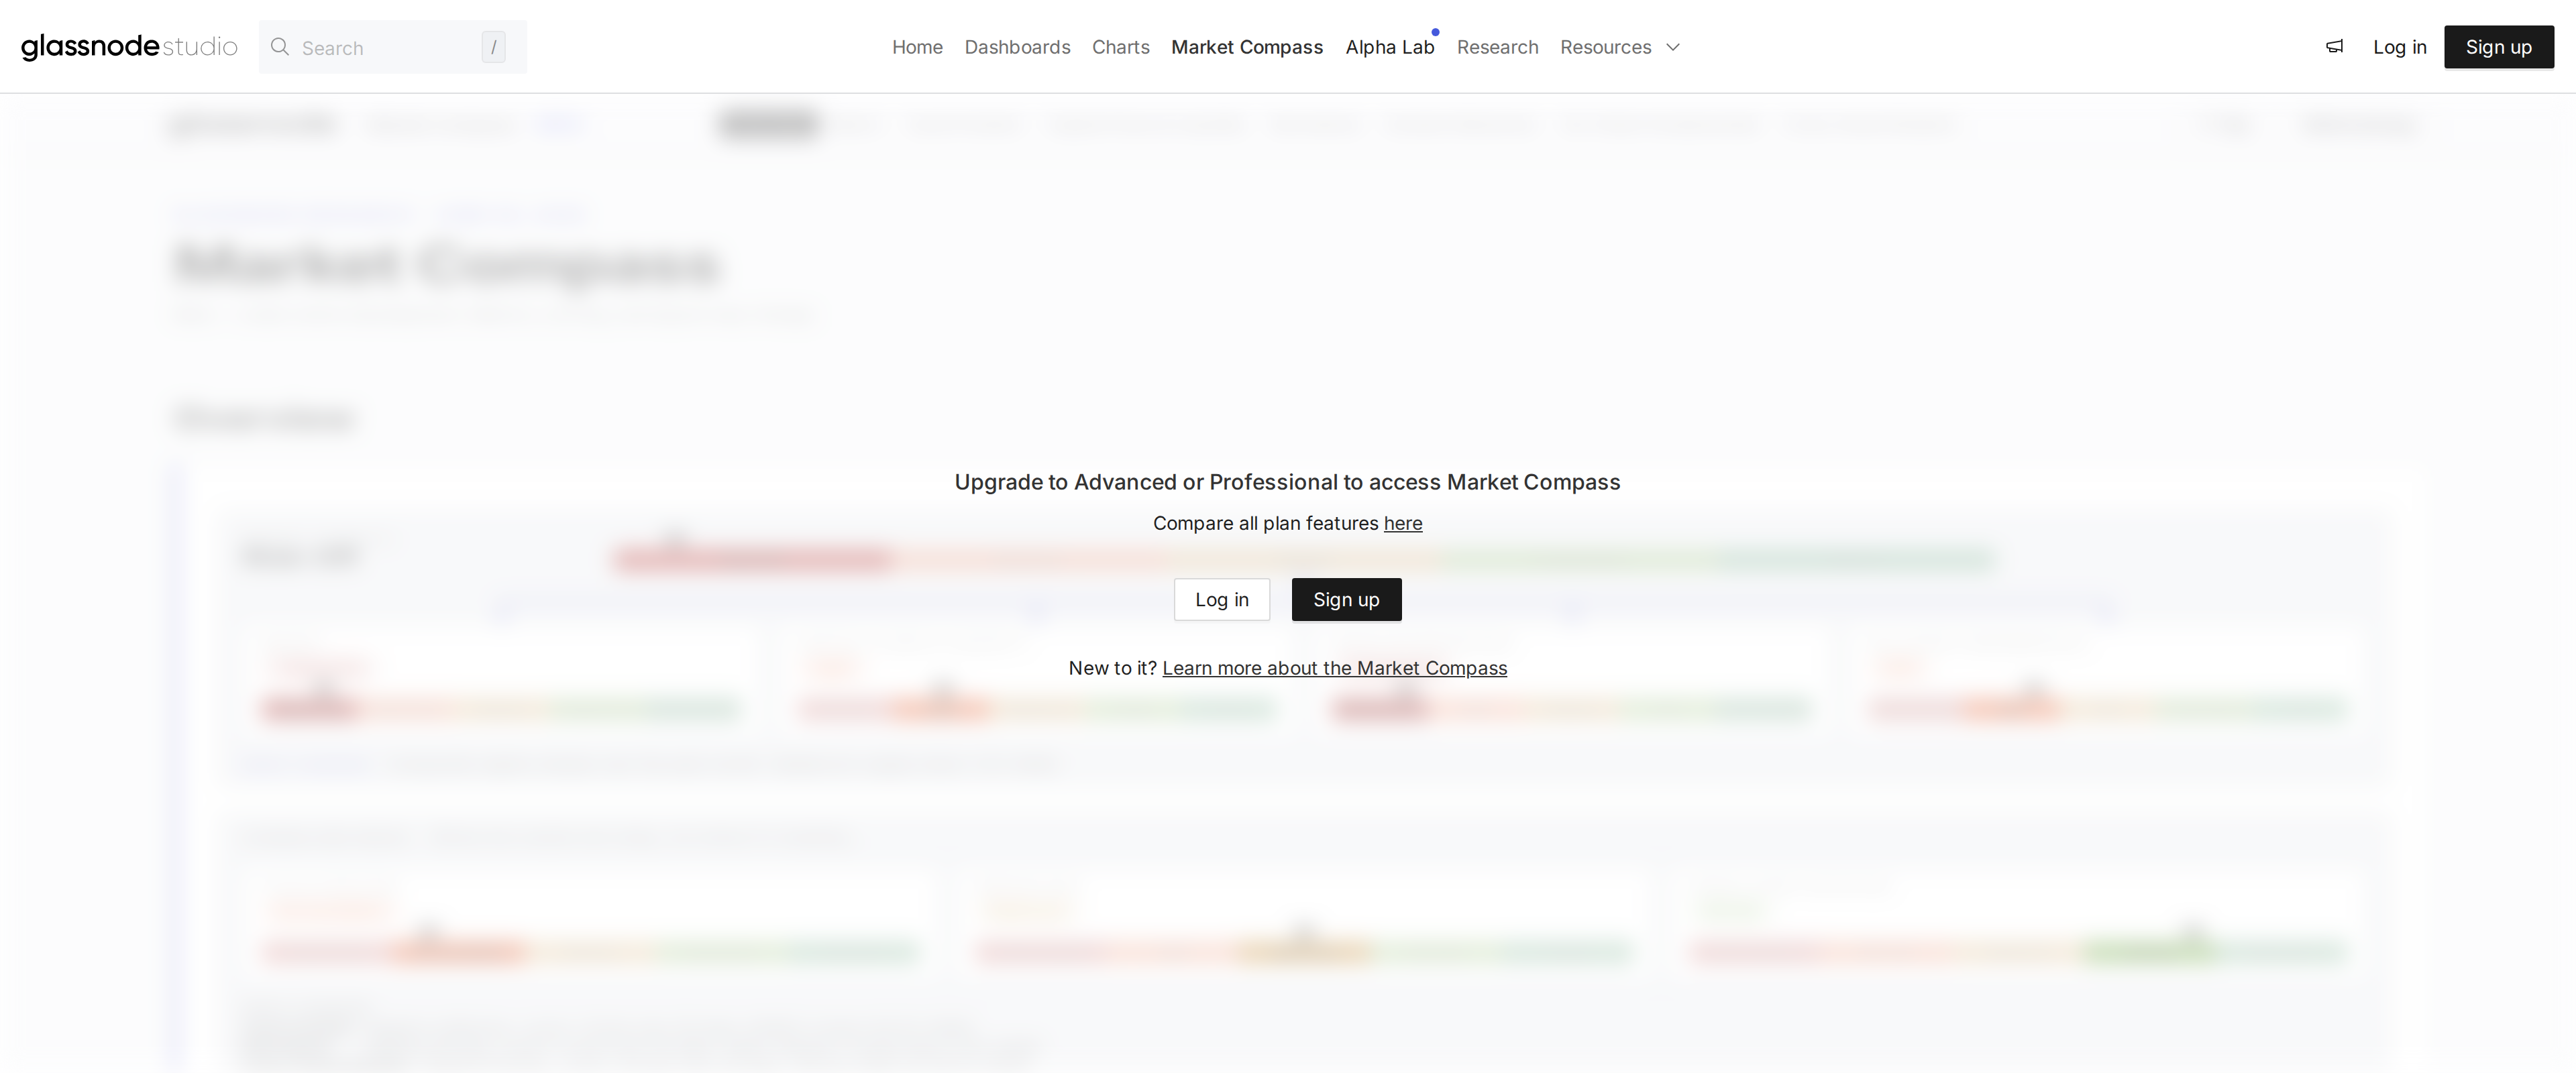
Glassnode's Market Compass dashboard, gated behind the Advanced or Professional plan for anyone not logged in with a paid seat
Push past the free tier and the paywall shows up fast. Market Compass, the tool built to summarize regime context across metrics rather than making you read each chart individually, sits entirely behind Advanced or Professional. That is a meaningful loss for a beginner specifically, since regime context is exactly what prevents a single metric from being misread in isolation, which the platform itself lists as one of its own biggest failure modes.
What $49 and $999 a month actually buy
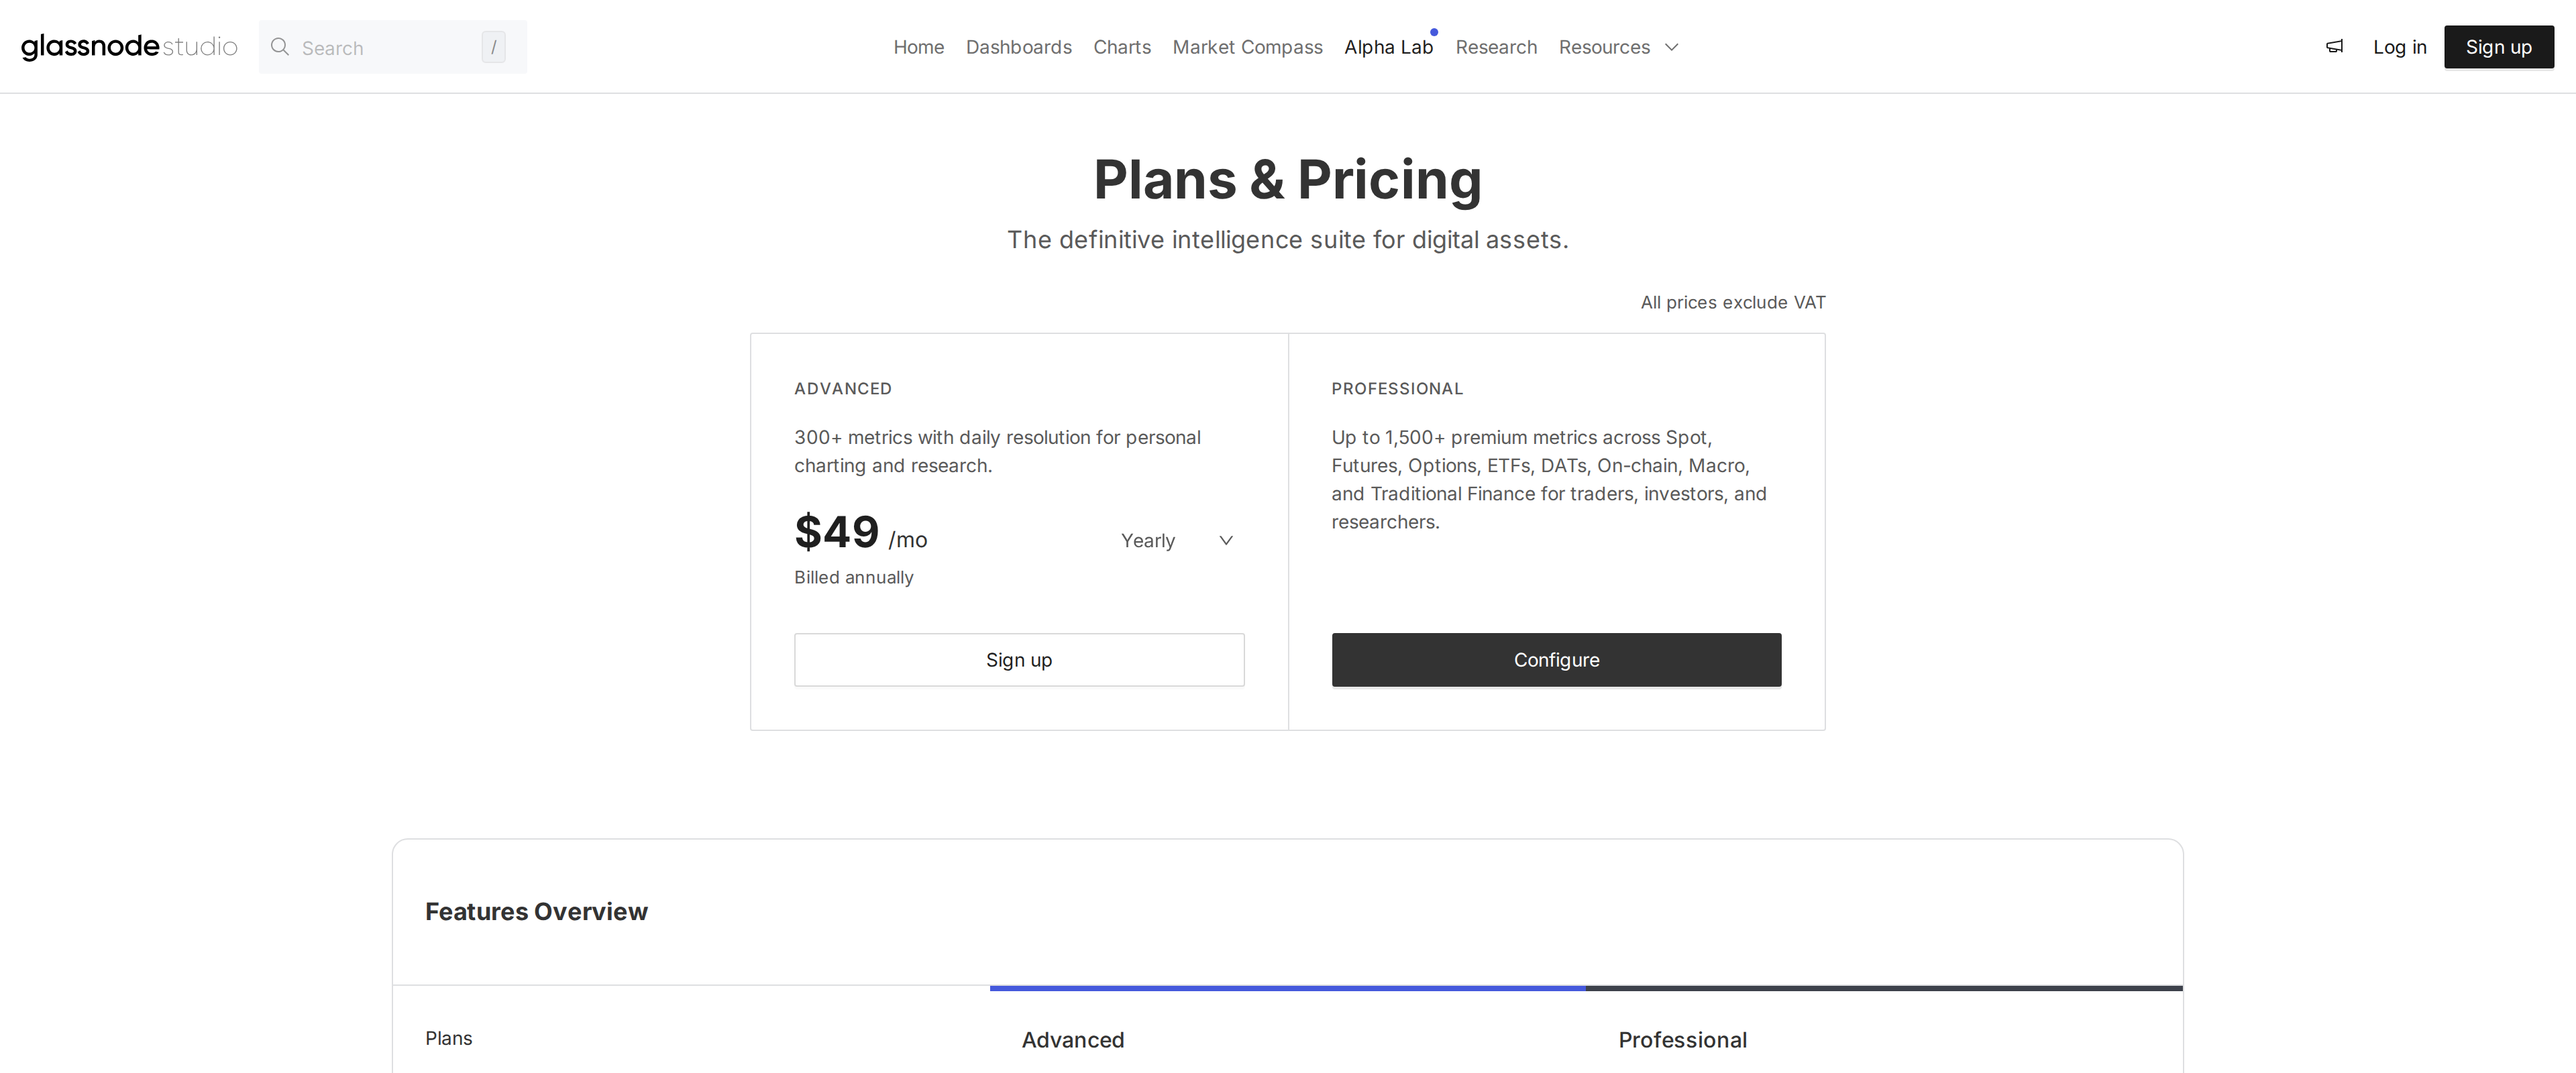
Glassnode's pricing page: Advanced at $49/mo against Professional's broader premium metric coverage
Advanced, at 49 dollars a month on annual billing, unlocks T2 metrics, hourly resolution, ten alerts and a year of derivatives history. That is a real upgrade for a swing trader who wants finer resolution than a daily candle, but the one-year derivatives window is thin if you are trying to backtest reactions across a full market cycle rather than the last few months.
Professional is a different product entirely: 999 dollars a month billed yearly, 1,500-plus metrics across 1,000-plus assets, 1-minute resolution and 500 alerts. Nothing about that tier is built for an individual holding a portfolio on the side; it is priced and scaled for a desk running strategies across dozens of assets simultaneously, and retail buyers who sign up for it are very likely paying for capacity they will never use.
Actionable versus impressive
The honest answer to whether on-chain data gives retail something beyond free charts is: yes, but only a specific slice of it, and only if you know which metrics to watch. Realized price zones, long-term holder supply and profit/loss cohort data are the three we would tell a long-term holder to actually check before scaling into or out of a position. Exchange netflow is the fourth: a sustained rise in coins moving onto exchanges has historically preceded sell pressure, and it is visible without the top-tier plan.
Everything past that, the 1,500-metric library, the 1-minute resolution, the cross-asset macro overlays, is built to be impressive rather than actionable for a retail reader, and Glassnode's own review coverage says as much: teams get stuck exploring instead of acting when given too much surface area. A casual investor chasing every available chart will learn less than one who picks four metrics and actually tracks them over time.
We tested this directly by watching the same four metrics for three weeks on a small BTC position rather than opening the full chart library each morning. The habit took under ten minutes a week and flagged a genuine shift in long-term holder supply before the price chart alone made it obvious, which is the entire case for paying attention to on-chain data in the first place.
Who should subscribe
A long-term holder who wants realized-price and holder-cohort context beyond a price chart, and who checks in on a position weekly rather than hourly, gets real value from the free tier alone and should think hard before paying for Advanced. A swing trader who needs hourly resolution and a year of derivatives history is the actual target for the 49-dollar tier. Anyone reaching for Professional as an individual investor should ask honestly whether they will use 1,500 metrics or whether four good ones, checked consistently, would have done the job for free.
What we liked
Free Studio Standard tier includes 24-hour resolution charts and T1 metrics with no card required
Realized cap, cost basis and long-term holder supply metrics identify price-sensitive supply zones a candlestick chart cannot show
Entity-adjusted metrics reduce the noise from exchange wallets and custodians being miscounted as many separate holders
4.5/5 rating on G2, with 200+ metrics tracked across BTC and ETH even before upgrading
What held it back
Professional tier runs $999/month billed yearly, priced for institutional desks, not individual investors
Advanced tier's derivatives data only covers a 1-year historical window, thin for backtesting a cycle
A single metric read without liquidity or regime context can mislead more than it informs, by the platform's own limitation